Documenting poop frequency for health reasons...
So... we're documenting our defecation routine!
tldr
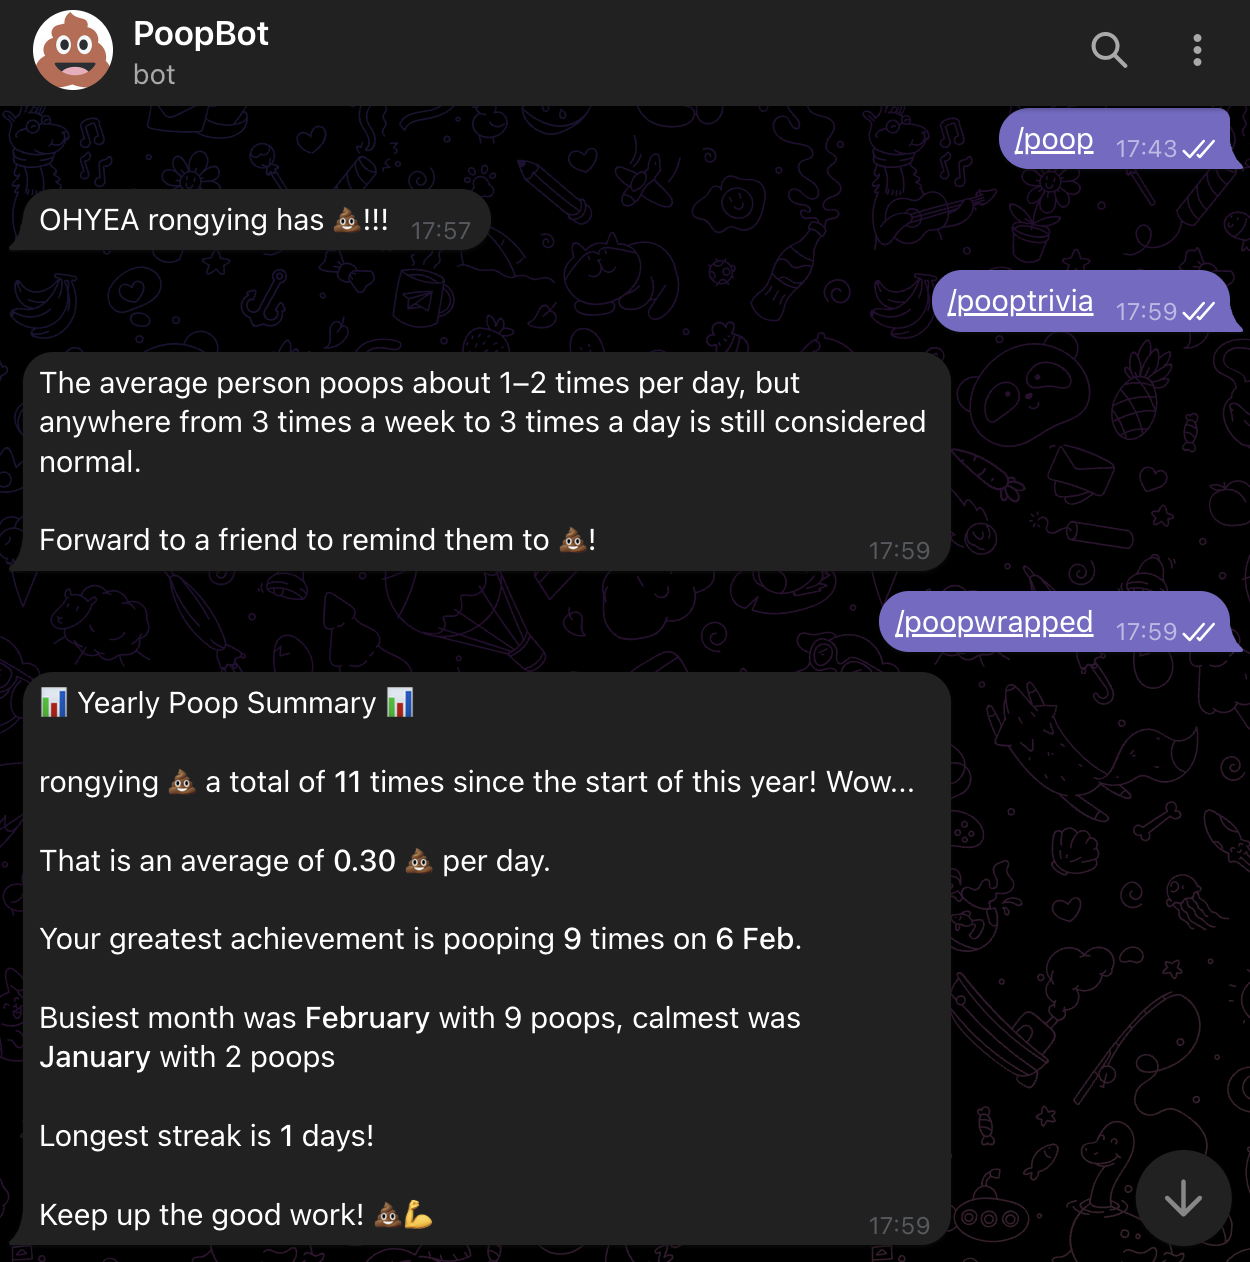
PoopBot is a telegram bot that users can interact with to record your Number twos. It tells you how often your bowel movement is in the past 30 days, provides trivia and even provides a wrapped analysis for your yearly poop intake!
Motivation
They say, you aren't close friends with someone unless you start telling them everything - including when you're engaging in excretion activities in the toilet. Close friends of mine started to text each other (coincidentally) while we poop.
It's not that weird. Hey, admit that you also use your phone while you're on the bowl! Don't think I don't know you're probably doom scrolling! So, as a joke, I created a telegram bot to automate this poop recording process because one of us seems to always be on the bowl more often than others...
It quickly became gametized when I started publishing statistics of number of poops, max frequency, streaks etc. In future releases, I also released a trivia handle, a poop wrapped feature where one can view their poop history over the course of a year.
The latest feature also involves a heat map (very github commit style I know - that's where the inspiration came from!).
High-level architecture
Not really a tech post without diving into the tech details. At the core, it is a python webhook reacting to events from Telegram through the bot interface.
- The webhook is a AWS Lambda with a python runtime behind an API gateway (alternatively, Lambda function URL would also suffice, as all you need is an endpoint url that you register with Telegram for your bot via the Telegram API and unique Bot Token)
- Register methods on BotFather
- Lambda handles different commands e.g. /poop, /results, /pooptrivia, /poopwrapped
- /poop command adds a new row in a dynamodb table with a TTL set to 365++ days
- /results will read from the table and perform simple calculations and return a formatted response
- /poopwrapped reads from the same table and performs more calculation similarly
- /poopmap reads from the table, creates a heatmap using python library july, saves it in S3 and creates a pre-signed URL. Returns a response of
sendPhotoinstead ofsendMessage
Visualization notes
The repo uses matplotlib and a package named july (a fork is used due to upstream issues) to render a calendar-style heatmap.
Because plotting libraries are large, the project documents the use of prebuilt Lambda layers for matplotlib and numpy so the function can import them at runtime without bundling them in the ZIP.
Deployment & CI
The repository includes a GitHub Actions workflow for CI (see .github/workflows) and references manual steps to add runtime dependencies as Lambda layers.
Next steps / ideas
- Add a lightweight dashboard to track submission patterns.
Closing
When-poop-bot is a pragmatic example of using serverless functions and plotting libraries to generate privacy-focused health visualizations. Aka, just for fun!
Source code: https://github.com/kohrongying/when-poop-bot
Did you know this was built with 11ty and tailwind? And works even with Javascript disabled? Yeah I don't care either.